> ## Documentation Index
> Fetch the complete documentation index at: https://vibekanban.com/docs/llms.txt
> Use this file to discover all available pages before exploring further.
# Browser Testing
> Preview your app in the built-in browser, inspect components, and debug with full devtools
The built-in preview browser lets you test your application, inspect components, and open full devtools — all without leaving the workspace.
## 1. Configure a dev server
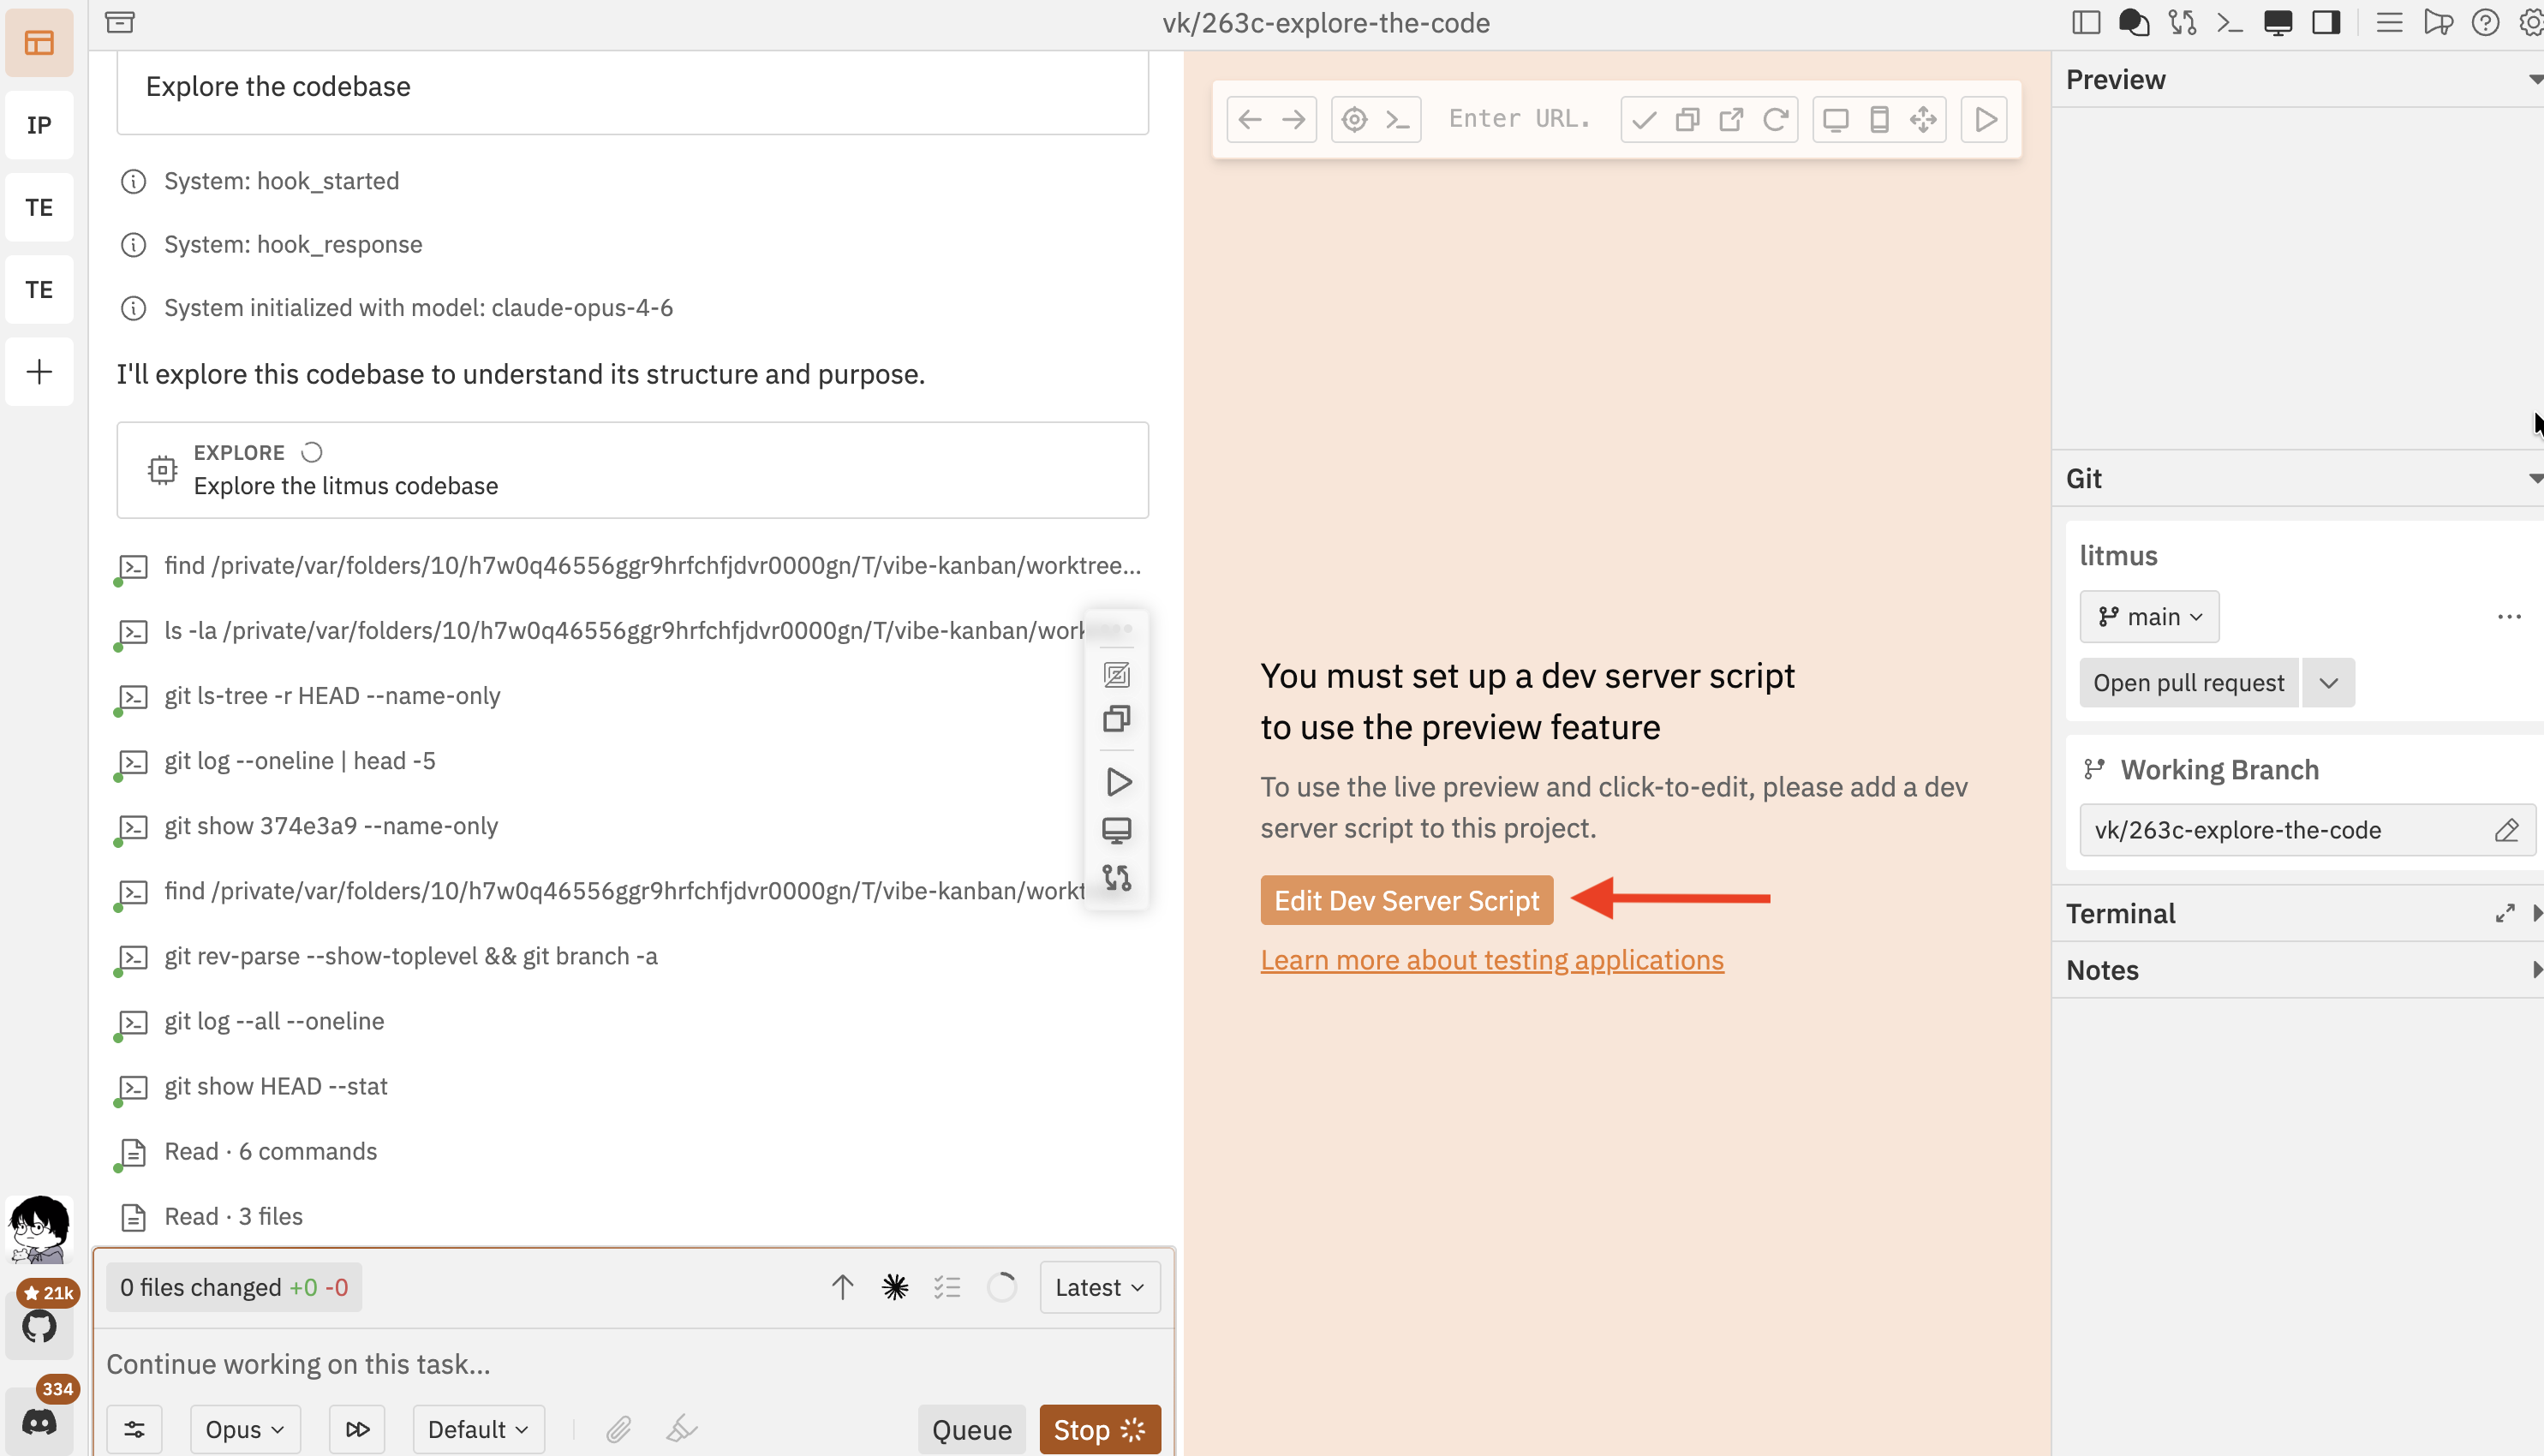
If no dev server script is configured, the preview panel shows a setup prompt. Click **Edit Dev Server Script** to open the script dialog.
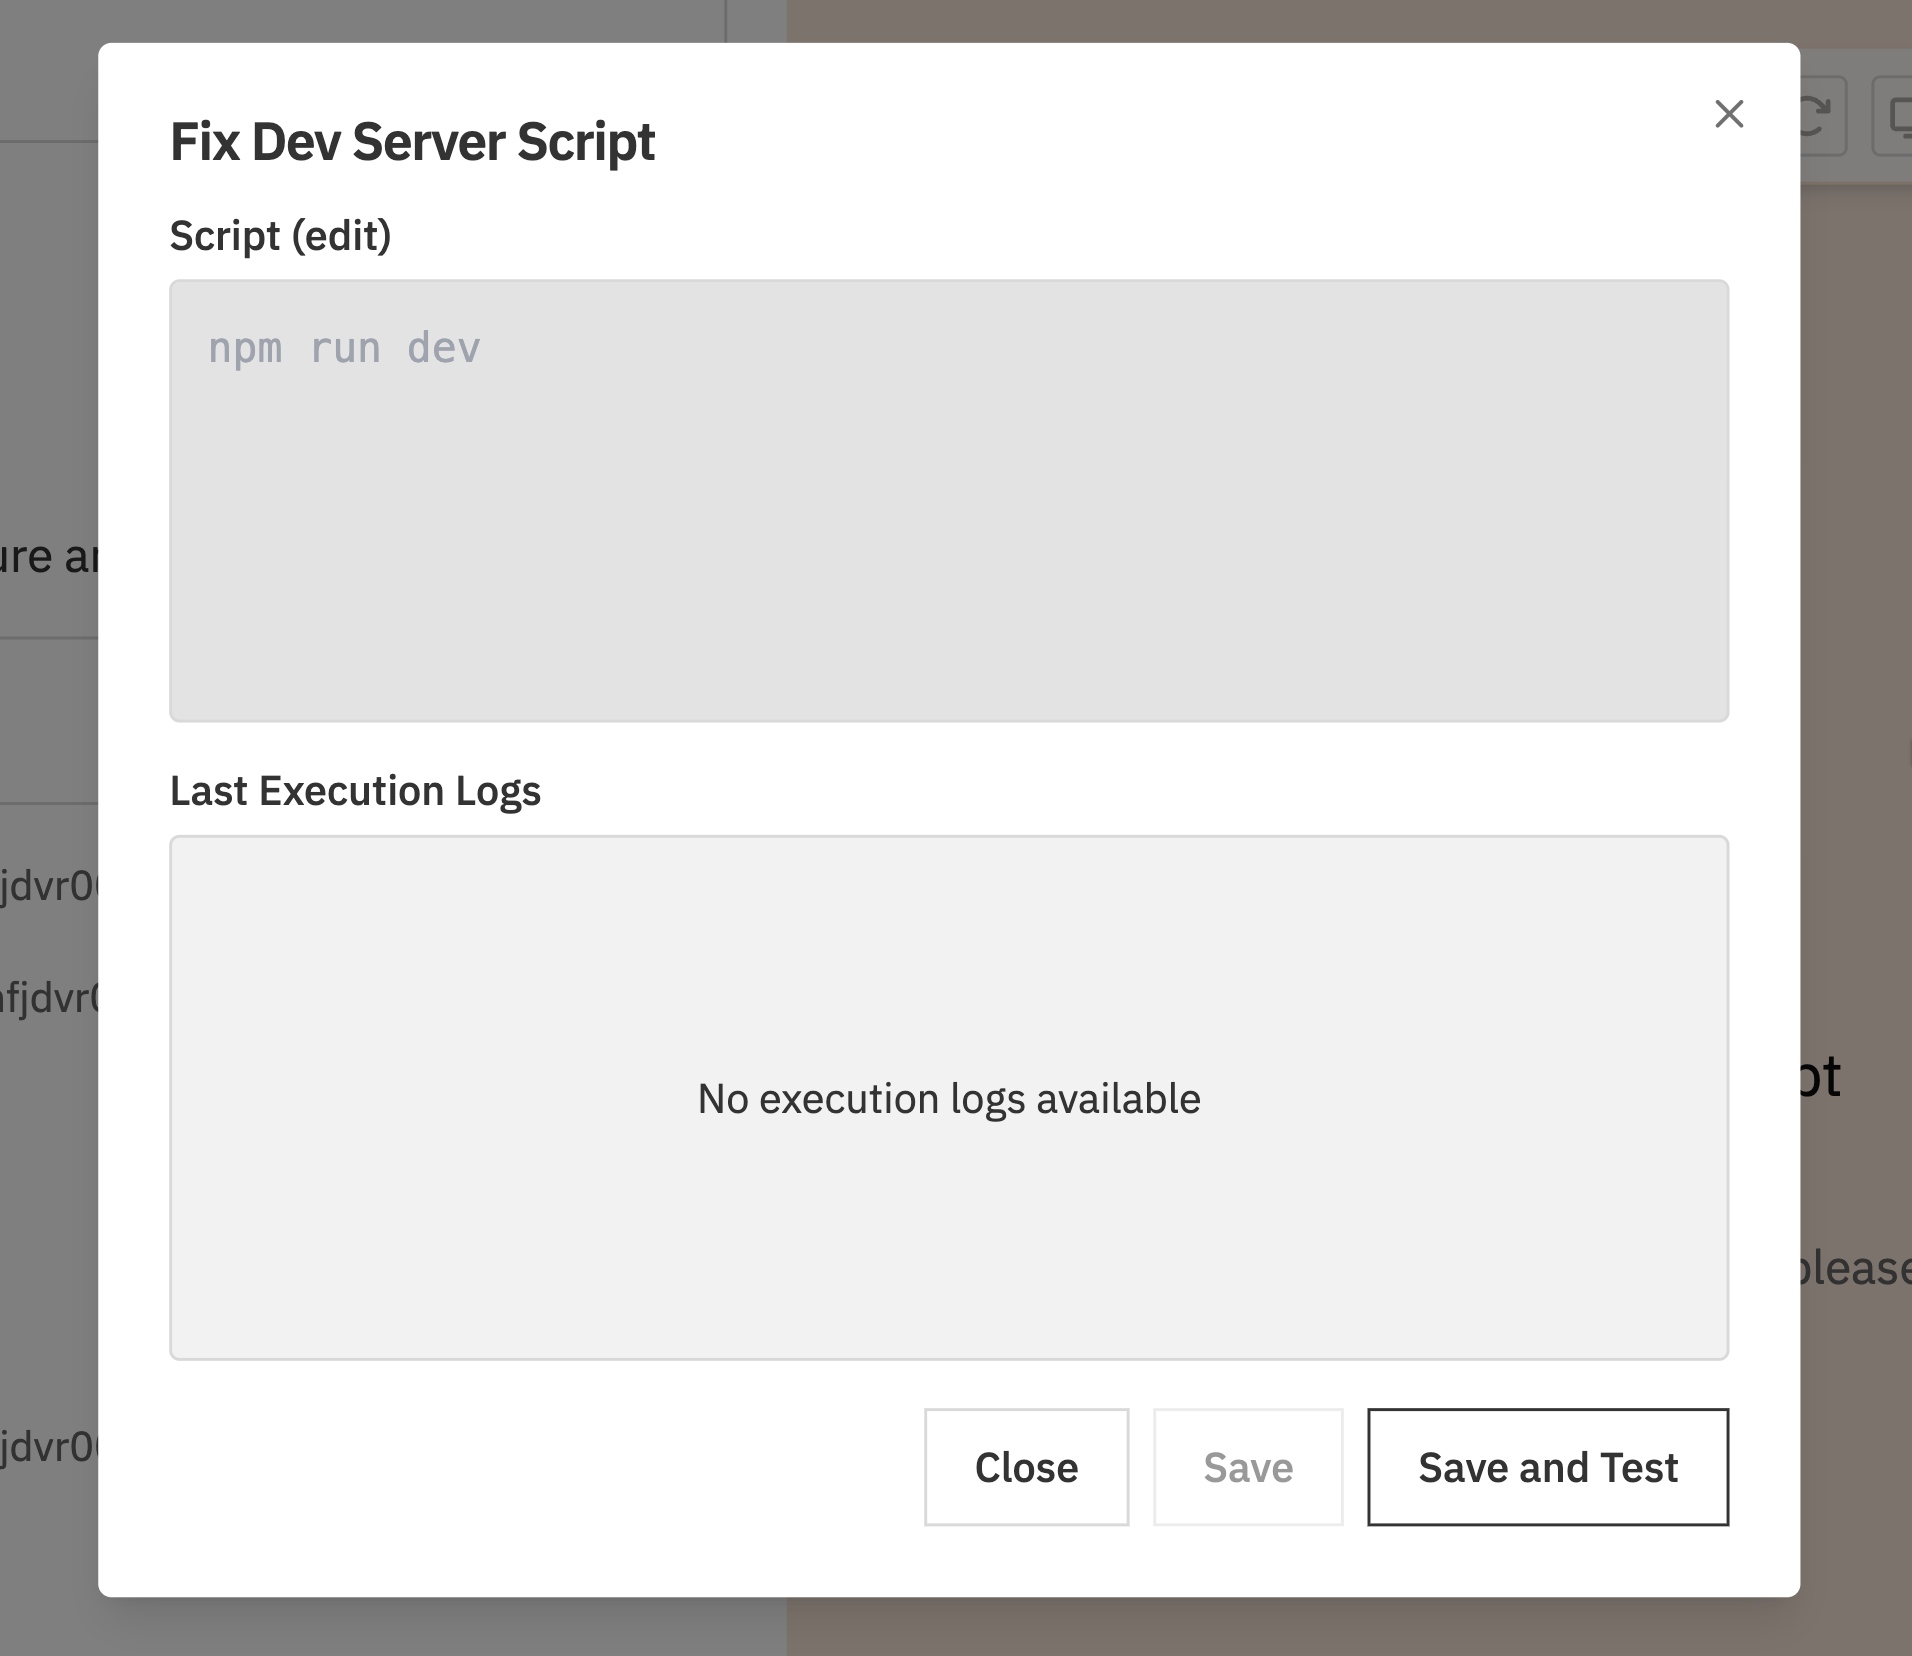
 Enter the command that starts your dev server (e.g. `npm run dev`, `pnpm dev`, `yarn dev`) and click **Save and Test** to verify it works.
 You can also configure dev server scripts from **Settings** → **Repos** → select your repository → **Dev Server Script**. See [Projects & Repositories](/settings/projects-repositories) for details.
## 2. Start the dev server
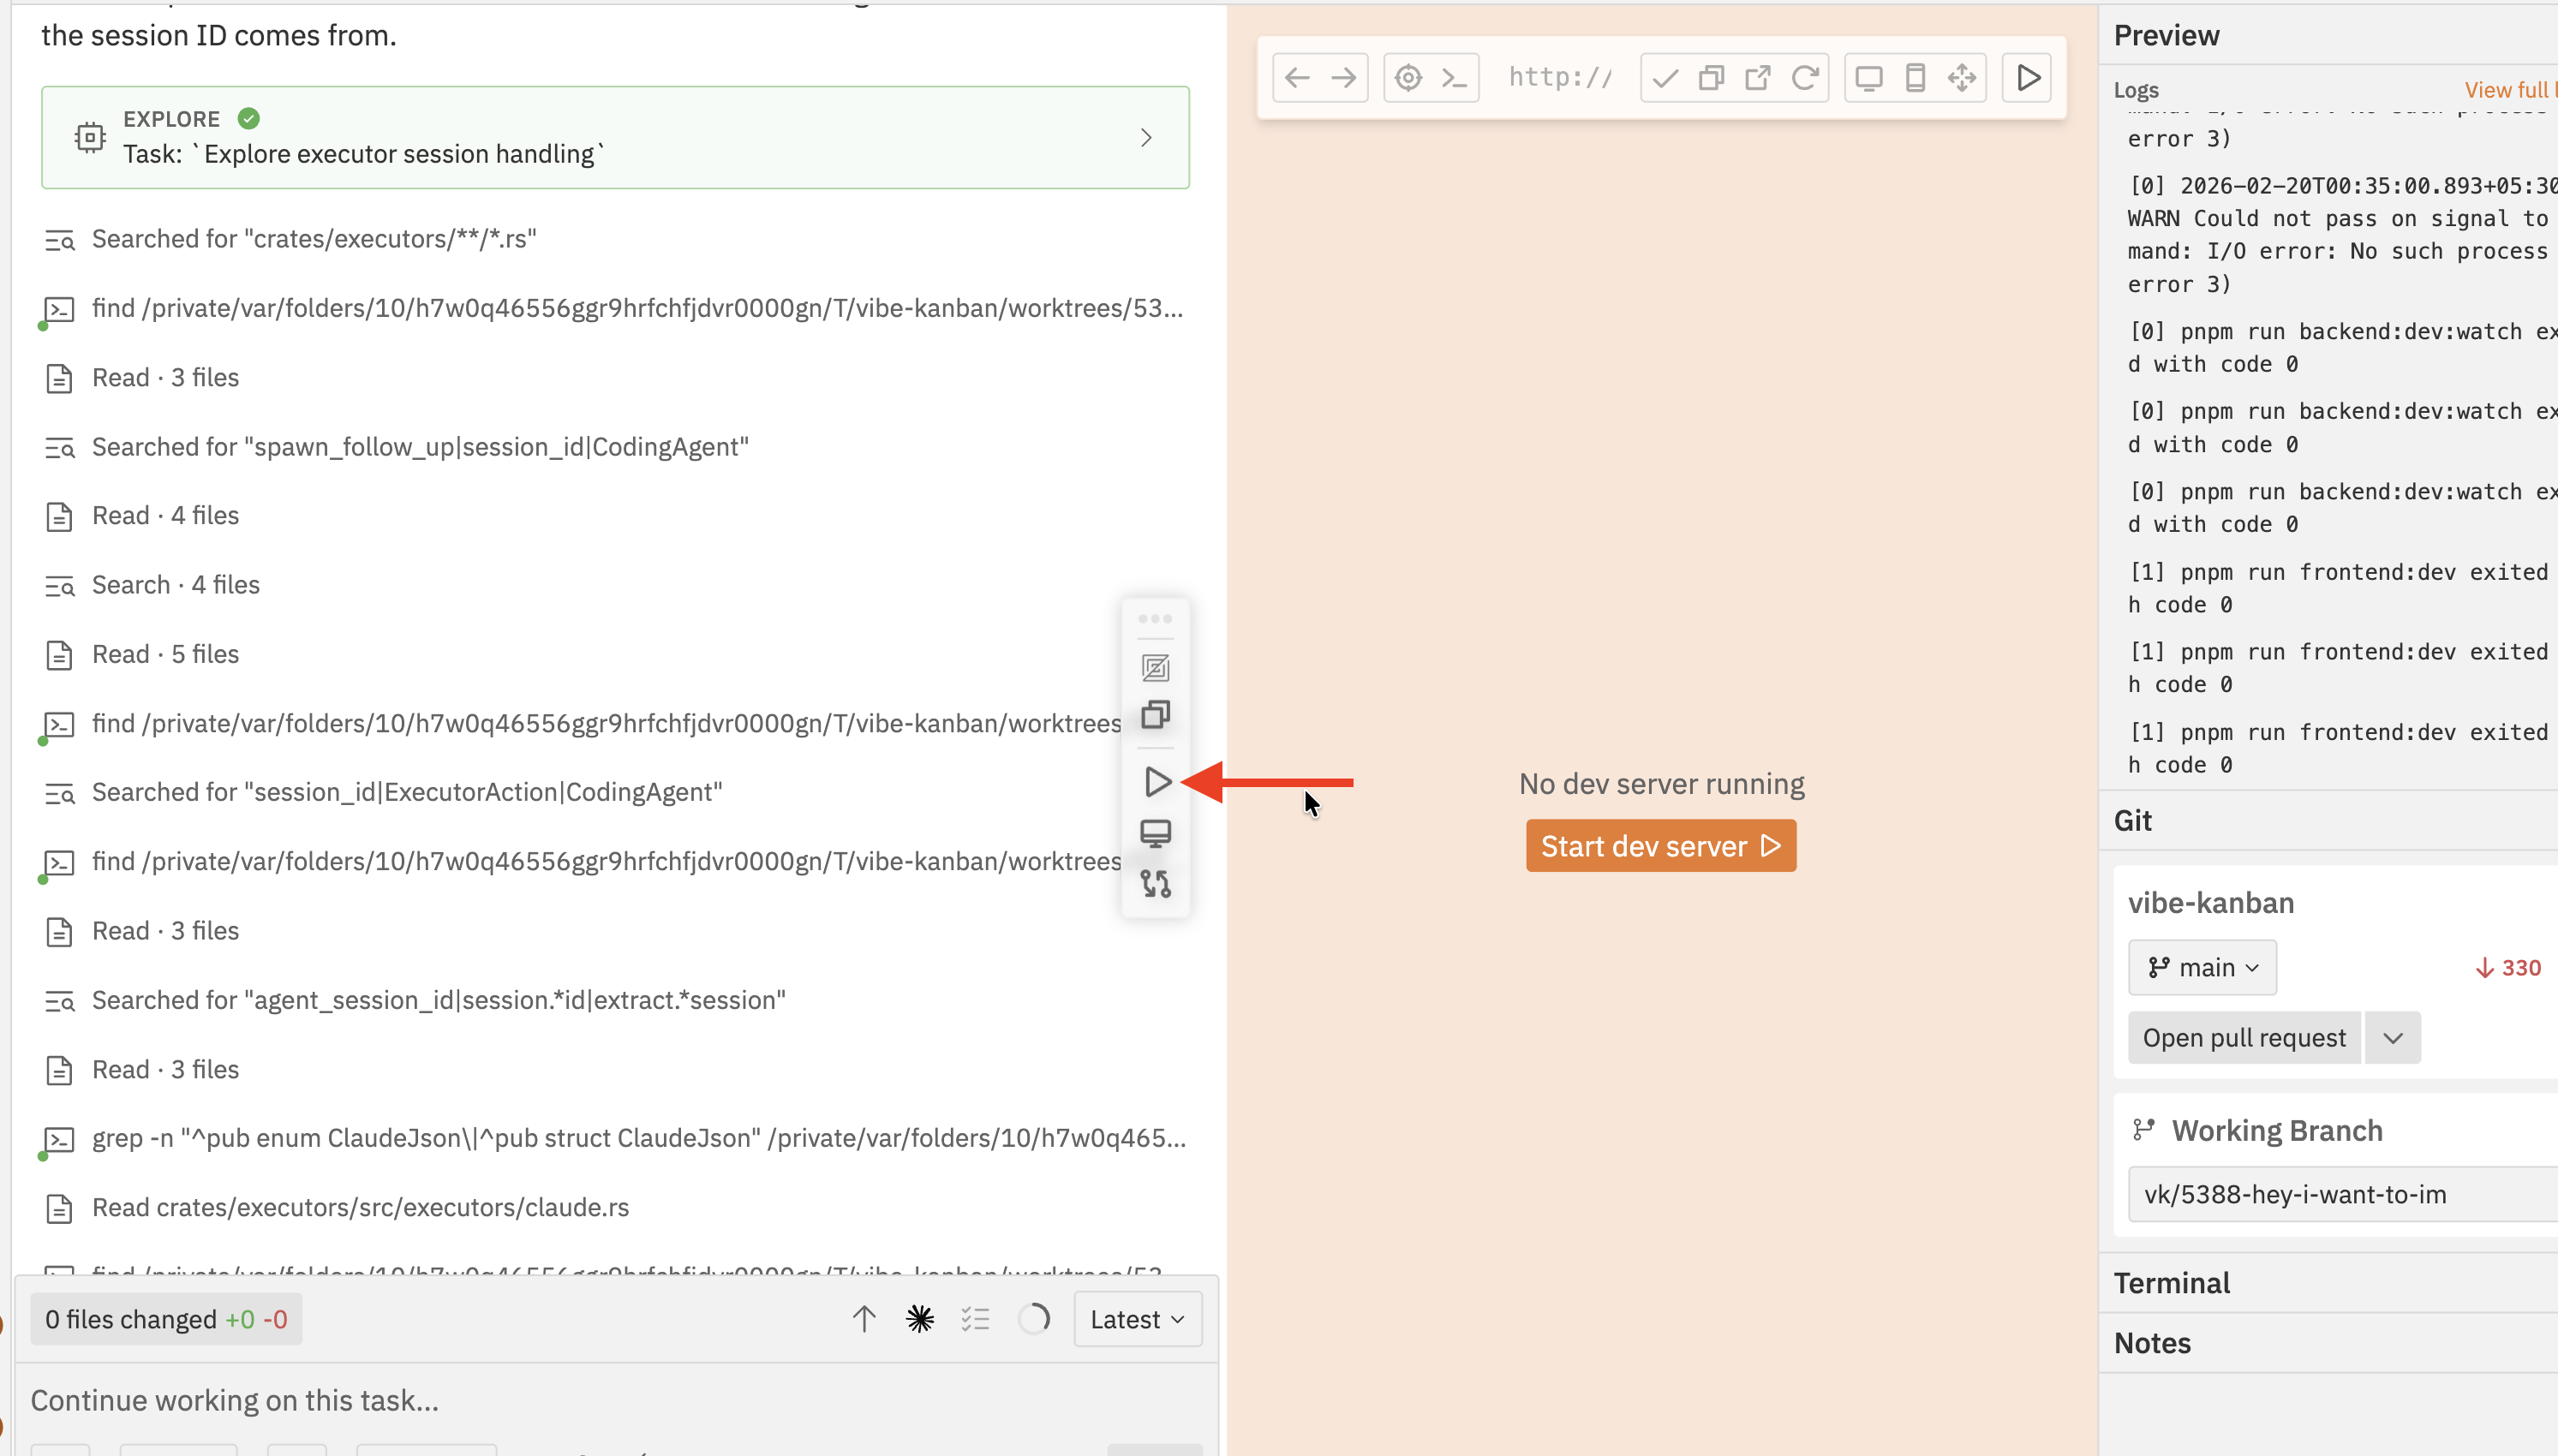
Once you've saved a script, click **Start dev server** in the preview panel to launch it.
You can also configure dev server scripts from **Settings** → **Repos** → select your repository → **Dev Server Script**. See [Projects & Repositories](/settings/projects-repositories) for details.
## 2. Start the dev server
Once you've saved a script, click **Start dev server** in the preview panel to launch it.
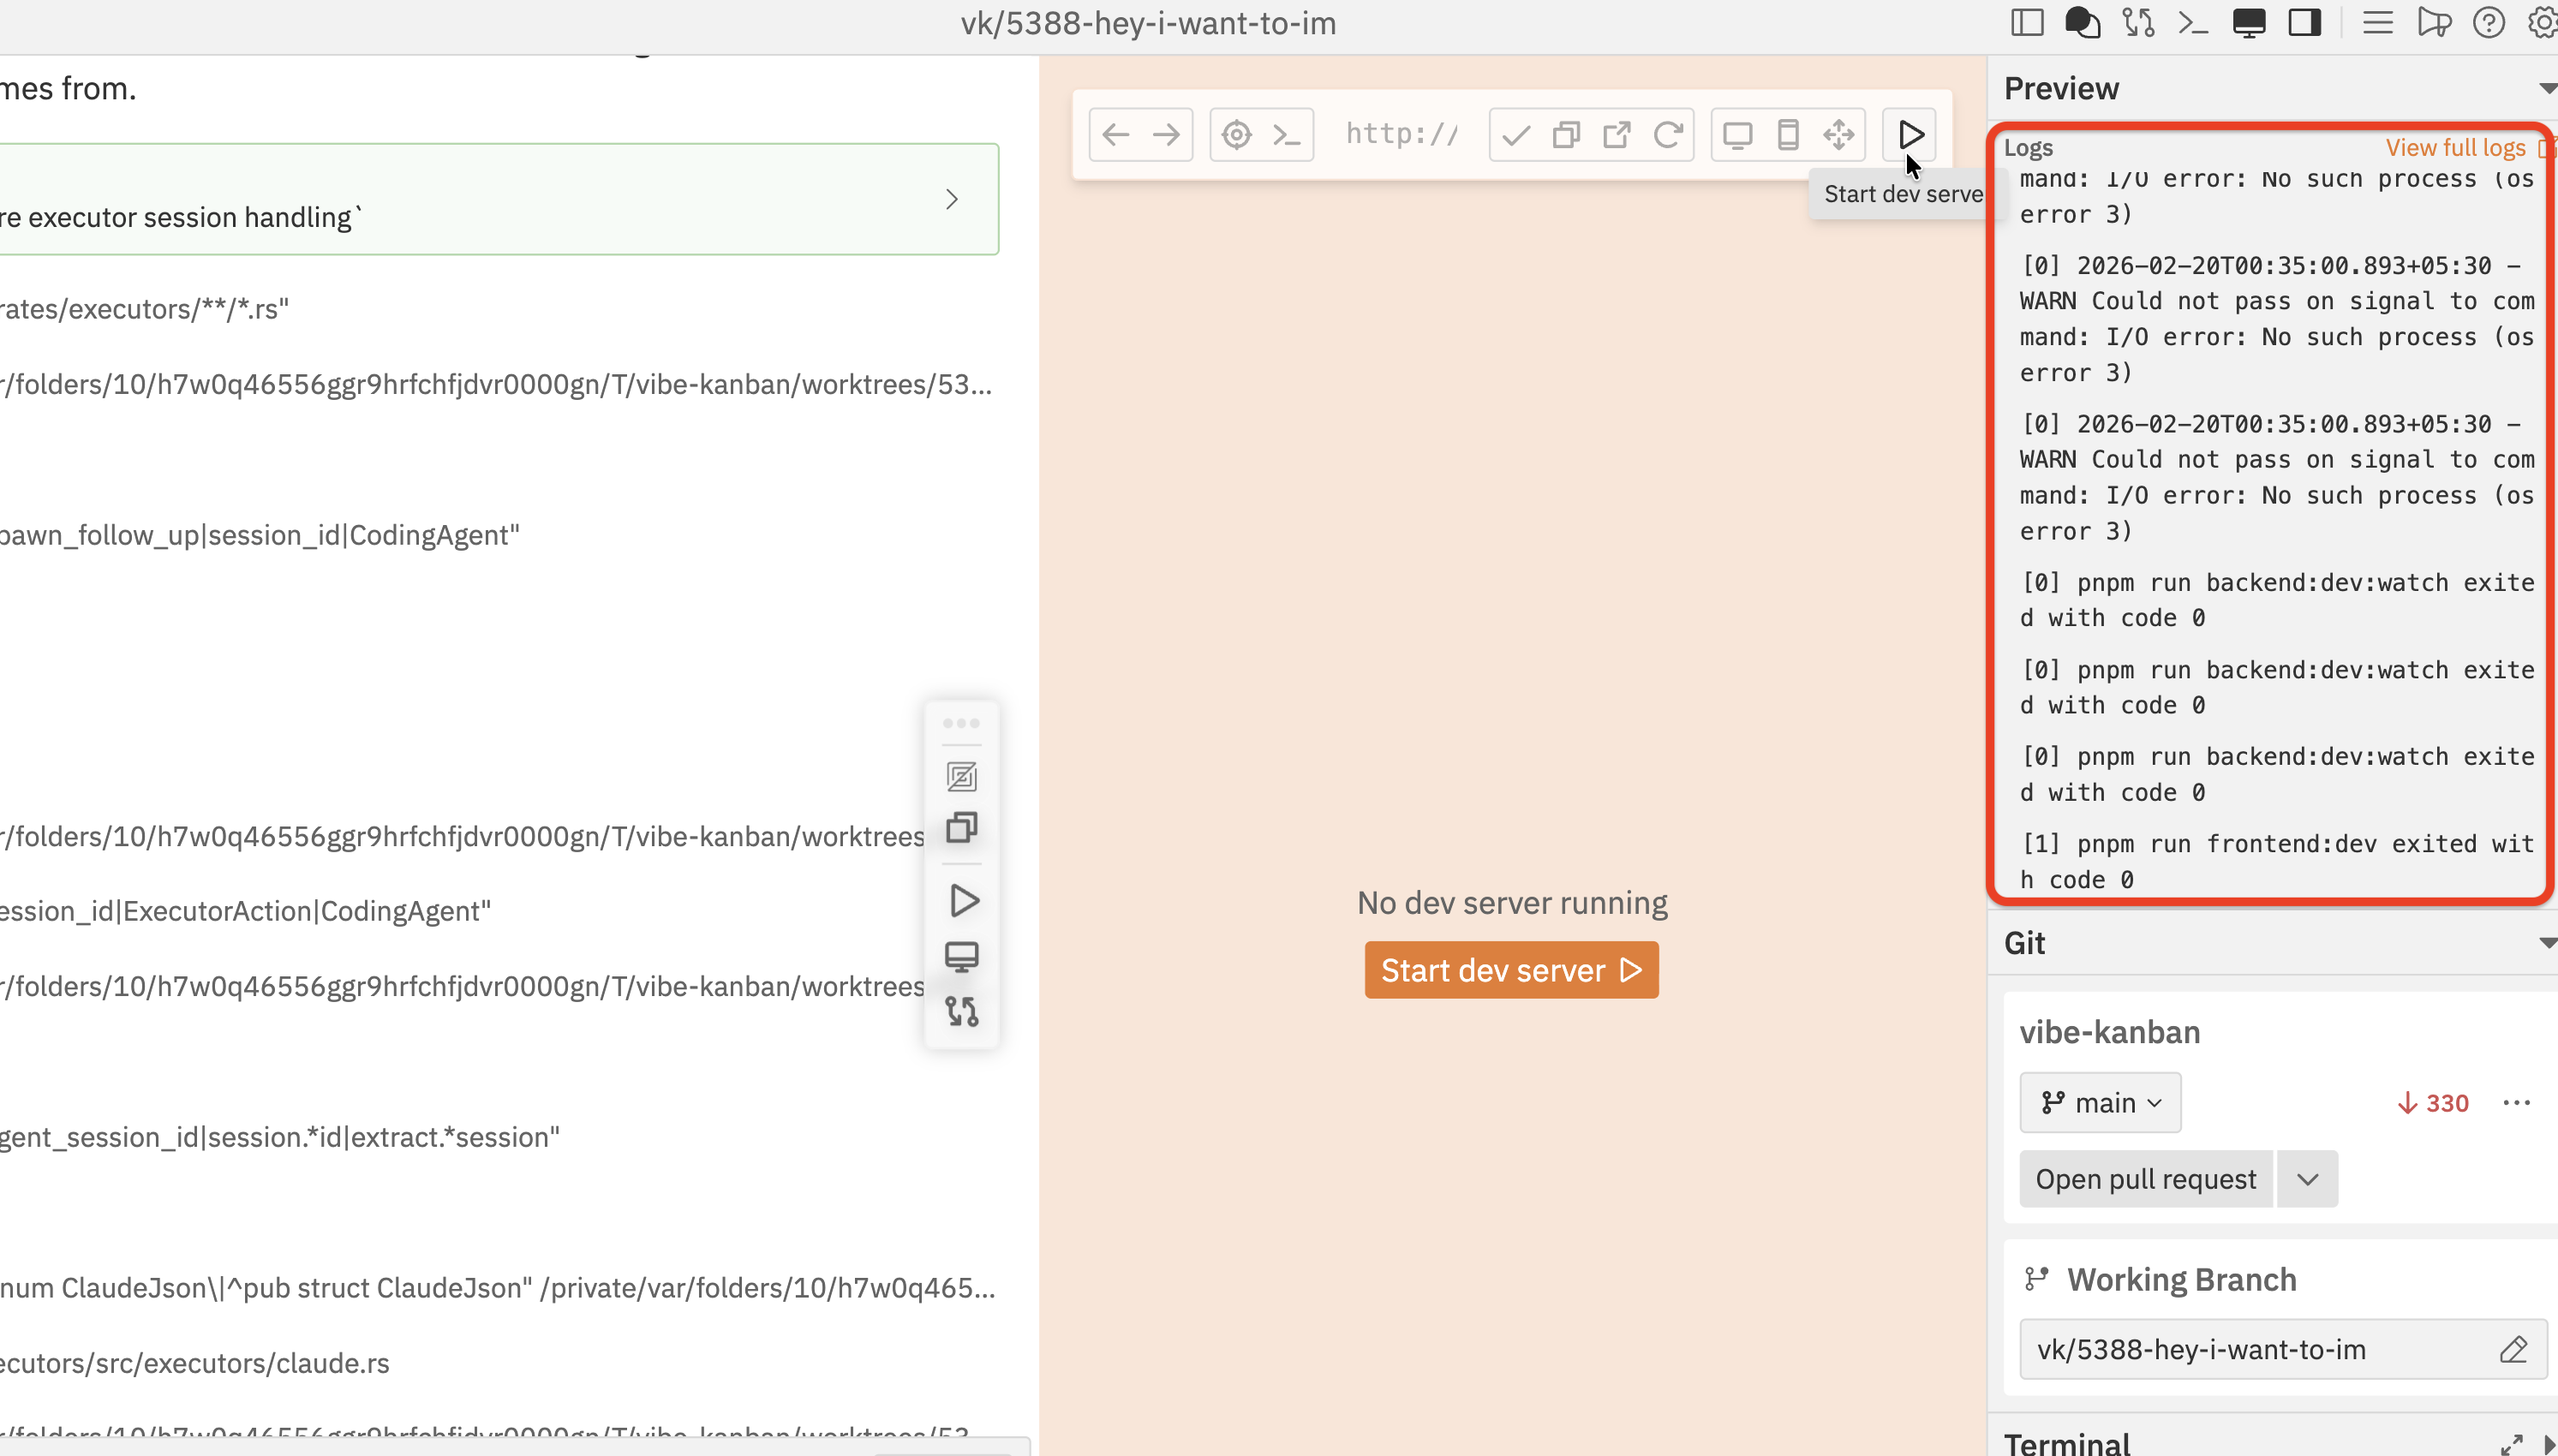
 Logs stream in real-time in the **Log** panel (highlighted in red) on the right side of the workspace. Look for the URL output (e.g. `http://localhost:3000`) — Vibe Kanban detects this automatically and loads it in the preview.
 ## 3. The preview browser
Once the dev server starts, your application loads in the built-in browser. Here's an overview of the preview toolbar and what each control does.
## 3. The preview browser
Once the dev server starts, your application loads in the built-in browser. Here's an overview of the preview toolbar and what each control does.
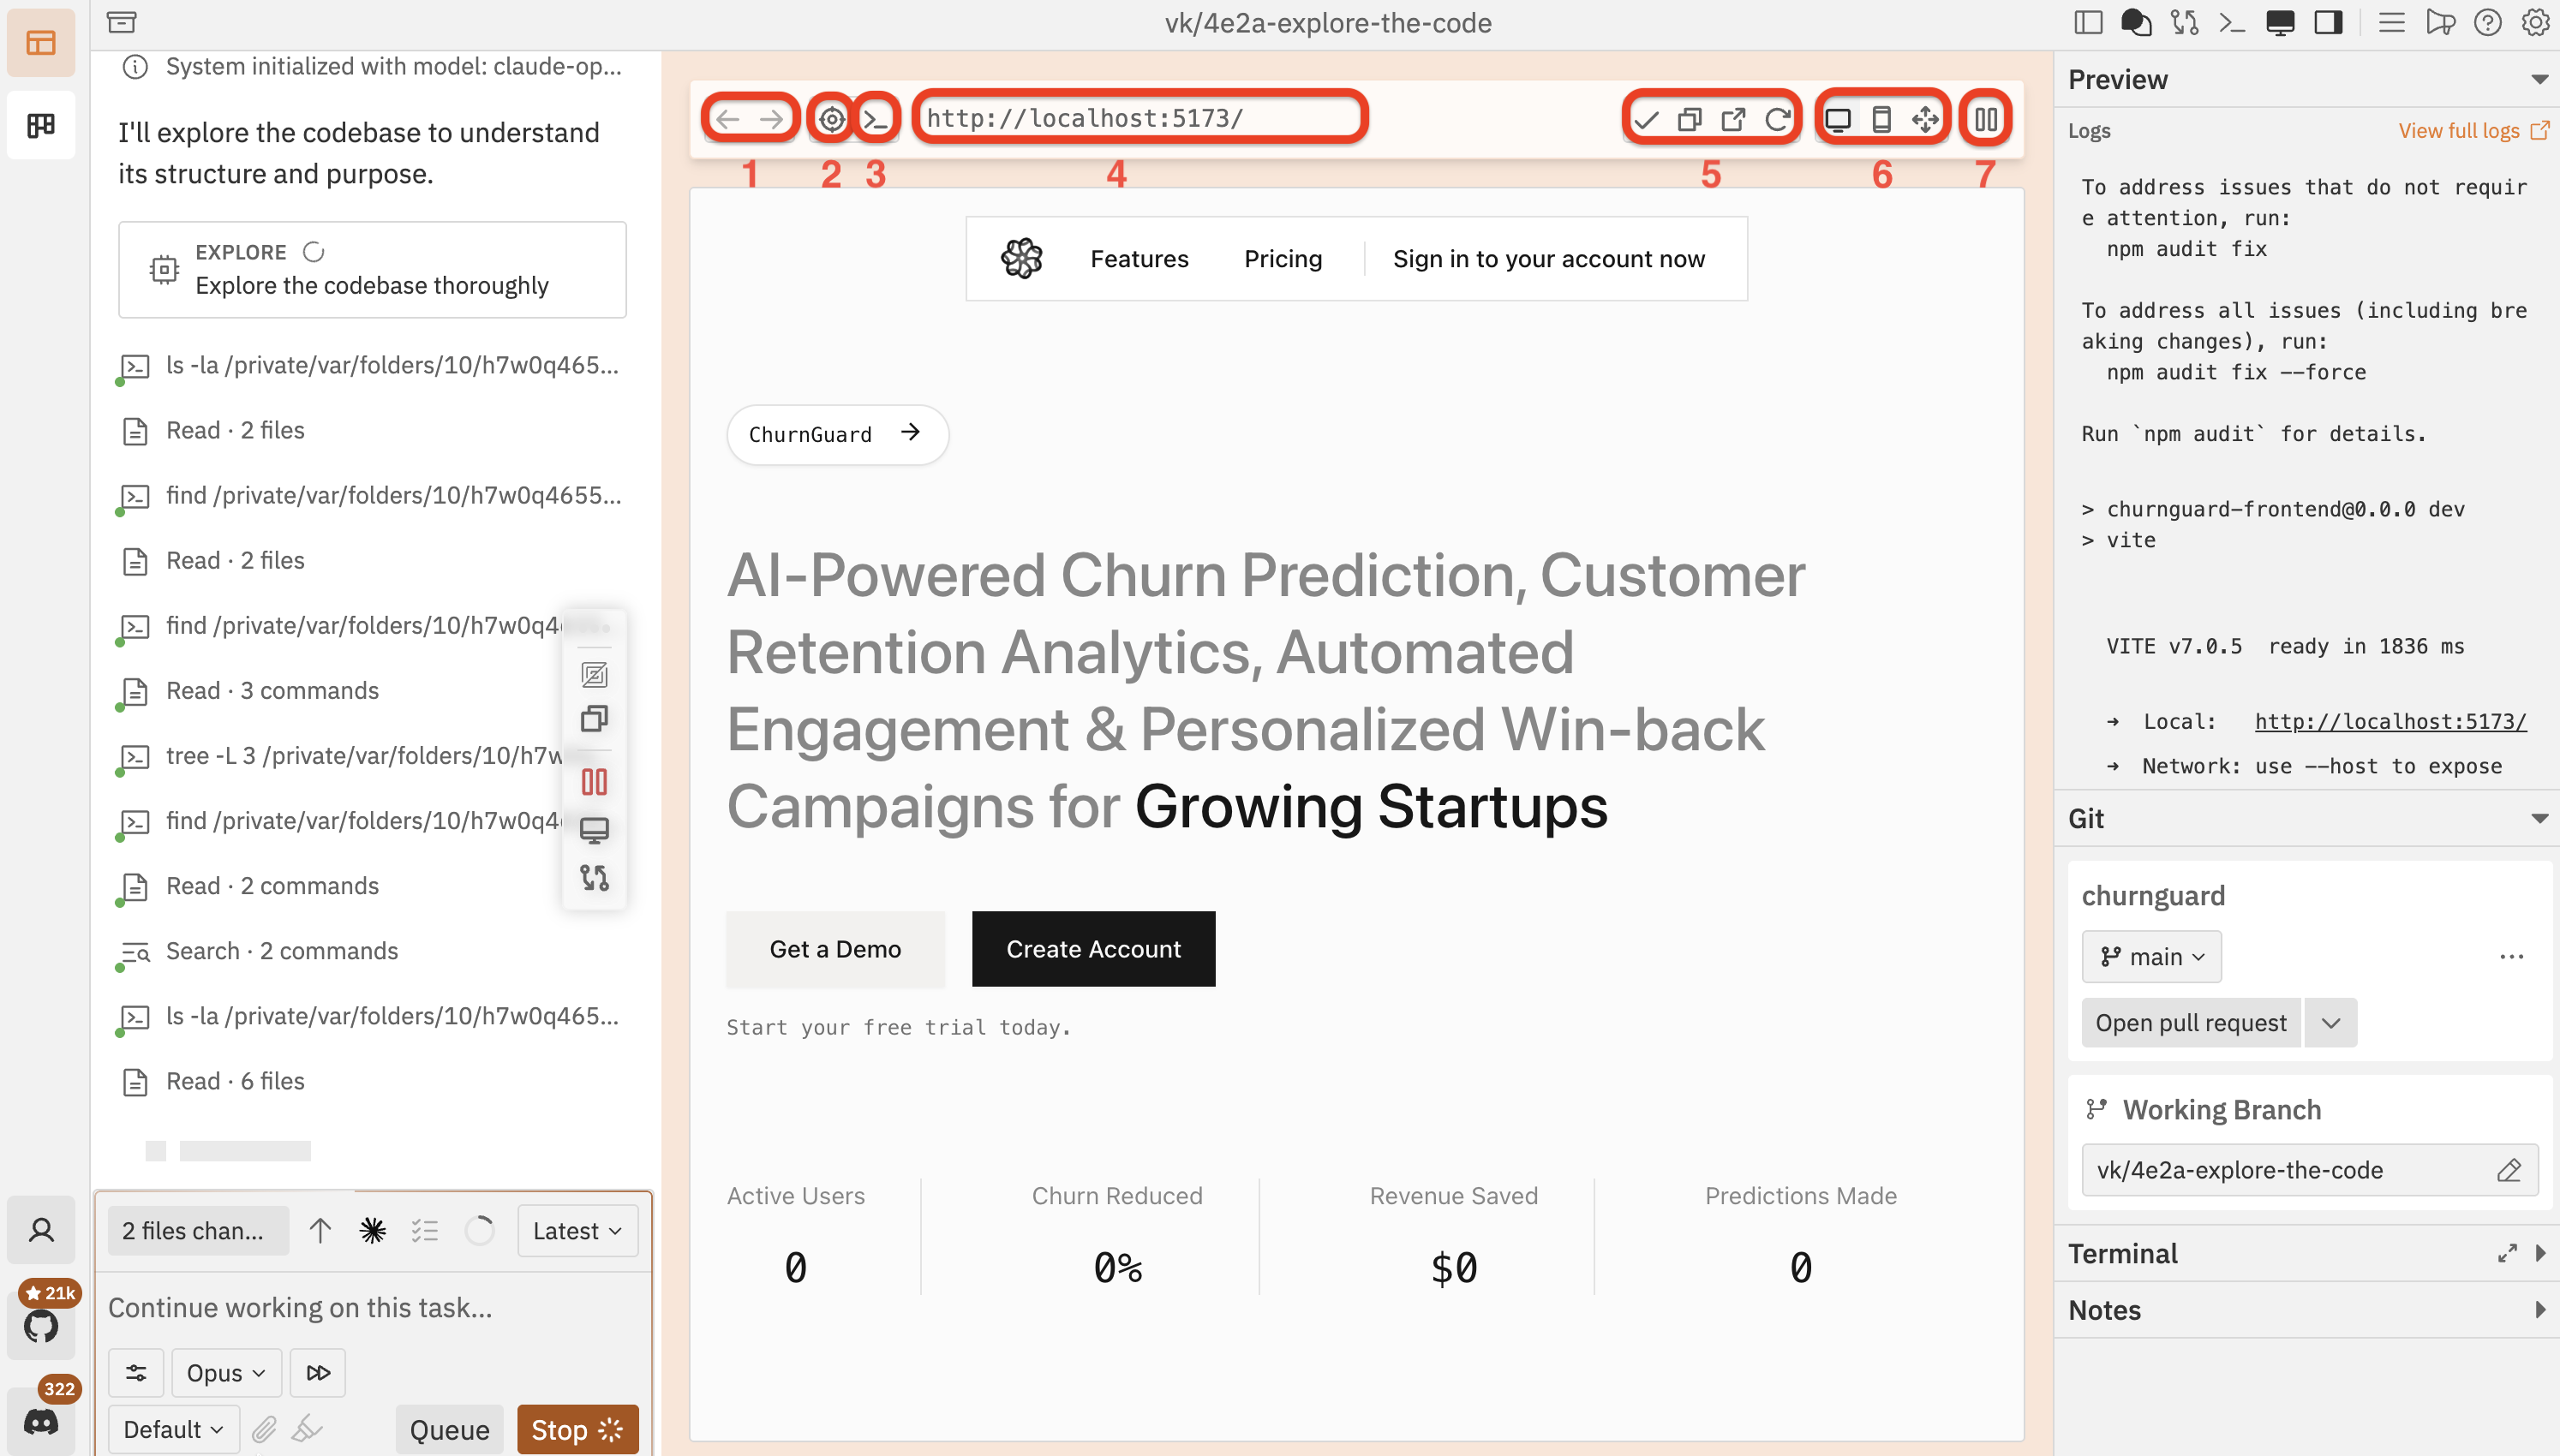 1. **Back / Forward** — navigate between pages
2. **Inspect** (crosshair icon) — enter click-to-component mode
3. **DevTools** (terminal icon) — toggle the built-in devtools panel
4. **URL bar** — shows the current page address; type a URL to navigate manually
5. **Page actions** — submit, copy the URL, open in a new tab, and refresh
6. **Device modes** — switch between Desktop, Mobile, and Responsive views
7. **Pause** — pause or resume the dev server
## 4. Switch device modes
You can test your application across different viewport sizes without resizing your browser window. The device mode buttons in the toolbar let you switch instantly.
| Mode | What it does |
| -------------- | ----------------------------------------------- |
| **Desktop** | Full-width browser view |
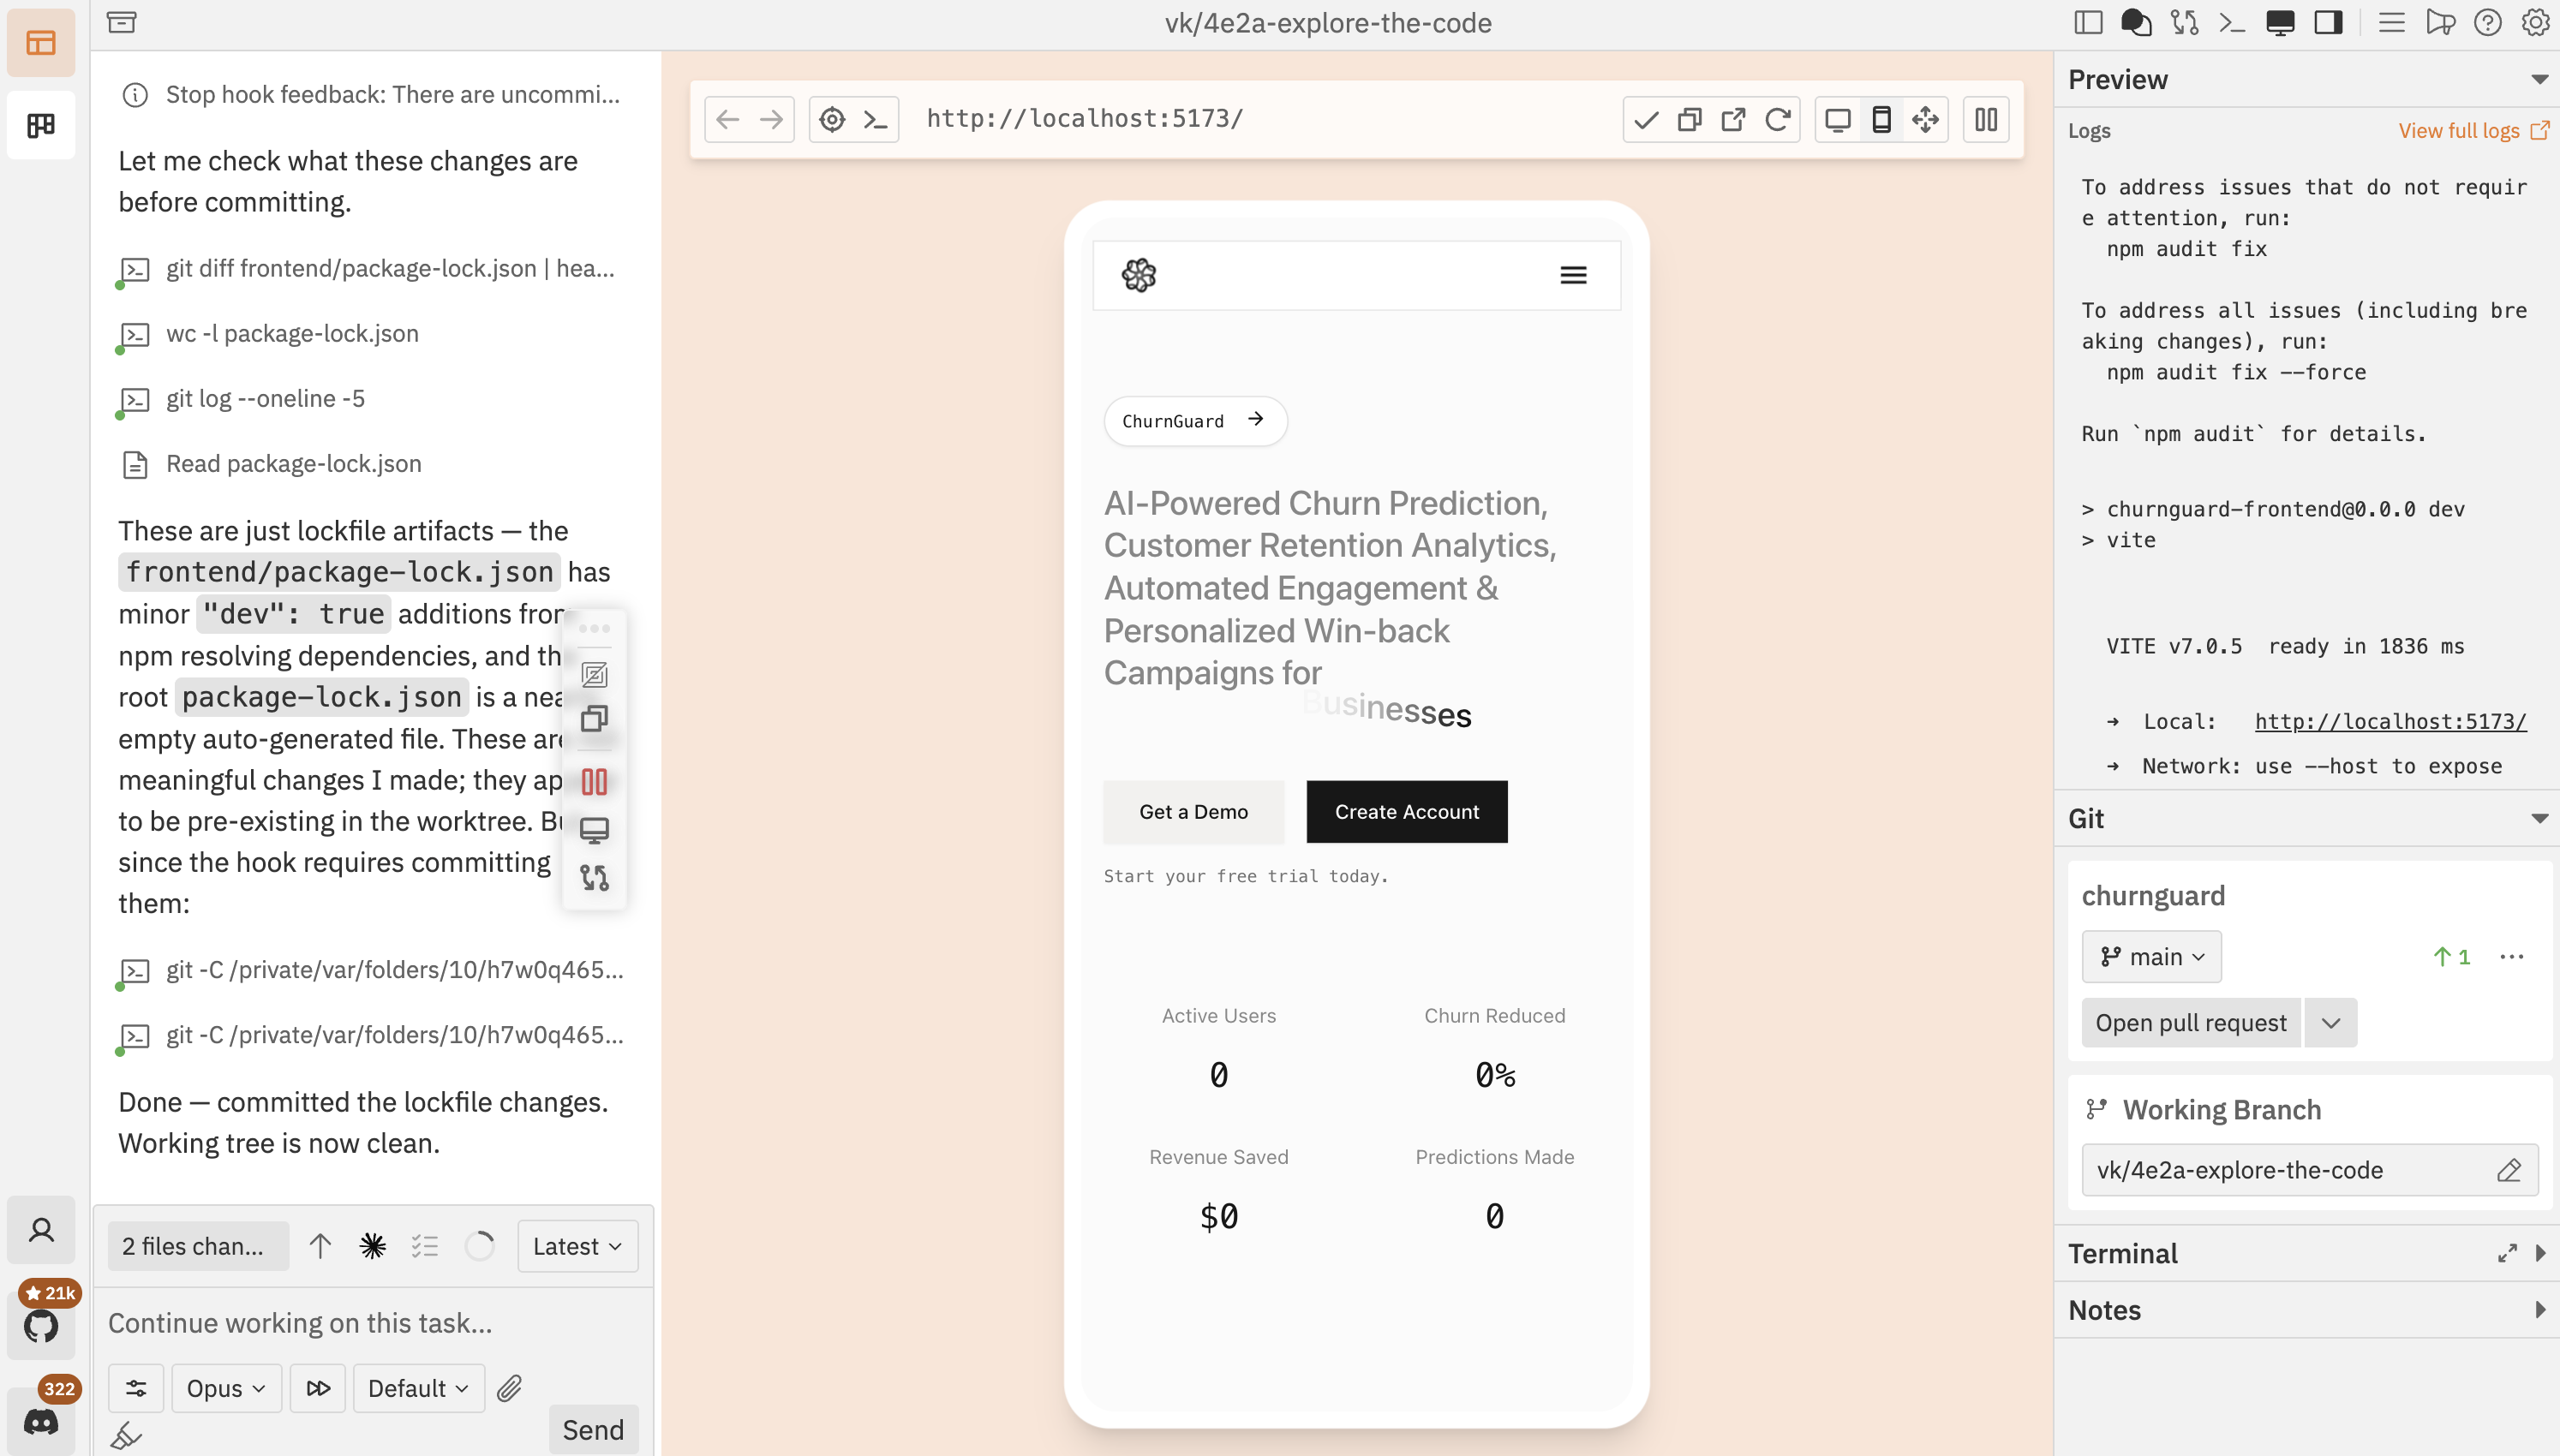
| **Mobile** | Phone frame at 390×844, with device chrome |
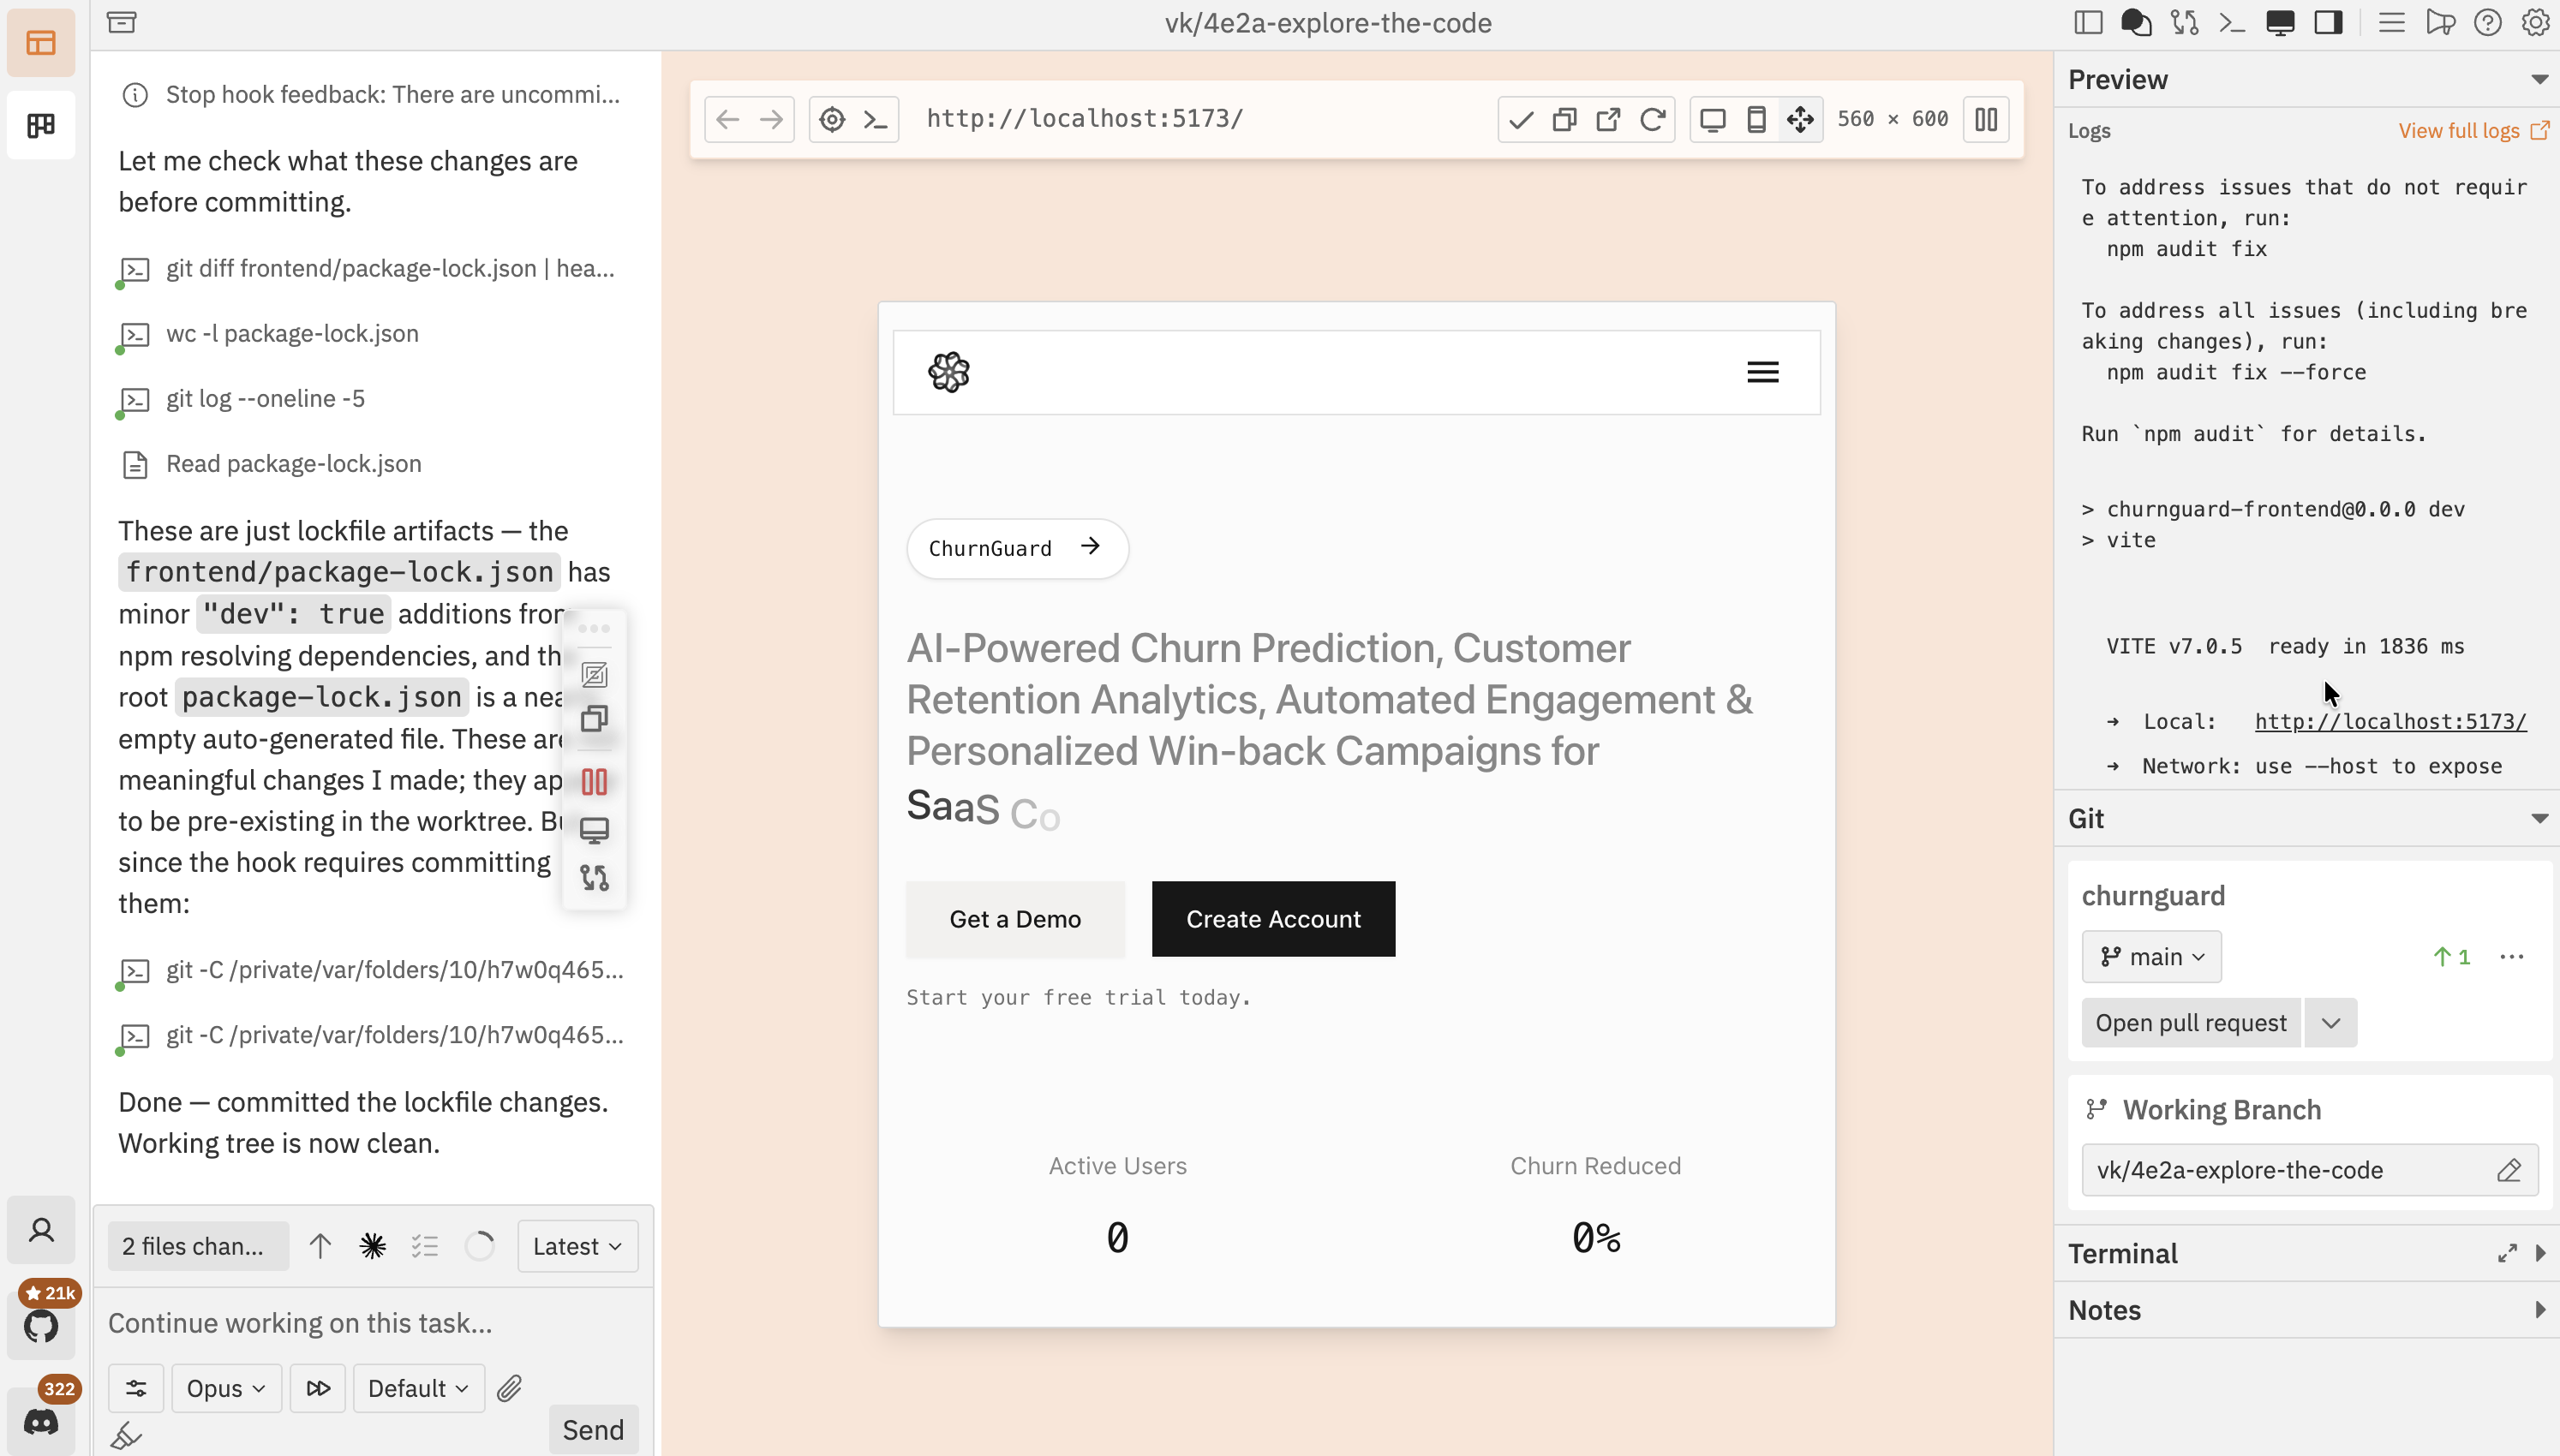
| **Responsive** | Drag the edges to set a custom width and height |
**Mobile mode** wraps your application in a phone frame so you can see exactly how it looks on a mobile device.
1. **Back / Forward** — navigate between pages
2. **Inspect** (crosshair icon) — enter click-to-component mode
3. **DevTools** (terminal icon) — toggle the built-in devtools panel
4. **URL bar** — shows the current page address; type a URL to navigate manually
5. **Page actions** — submit, copy the URL, open in a new tab, and refresh
6. **Device modes** — switch between Desktop, Mobile, and Responsive views
7. **Pause** — pause or resume the dev server
## 4. Switch device modes
You can test your application across different viewport sizes without resizing your browser window. The device mode buttons in the toolbar let you switch instantly.
| Mode | What it does |
| -------------- | ----------------------------------------------- |
| **Desktop** | Full-width browser view |
| **Mobile** | Phone frame at 390×844, with device chrome |
| **Responsive** | Drag the edges to set a custom width and height |
**Mobile mode** wraps your application in a phone frame so you can see exactly how it looks on a mobile device.
 **Responsive mode** lets you drag the edges of the preview to test any custom width and height.
 ## 5. Inspect components
The preview browser includes a built-in click-to-component feature. Click **Select element as context** in the toolbar to enter inspect mode, hover over any element to highlight it, then click to select.
## 5. Inspect components
The preview browser includes a built-in click-to-component feature. Click **Select element as context** in the toolbar to enter inspect mode, hover over any element to highlight it, then click to select.
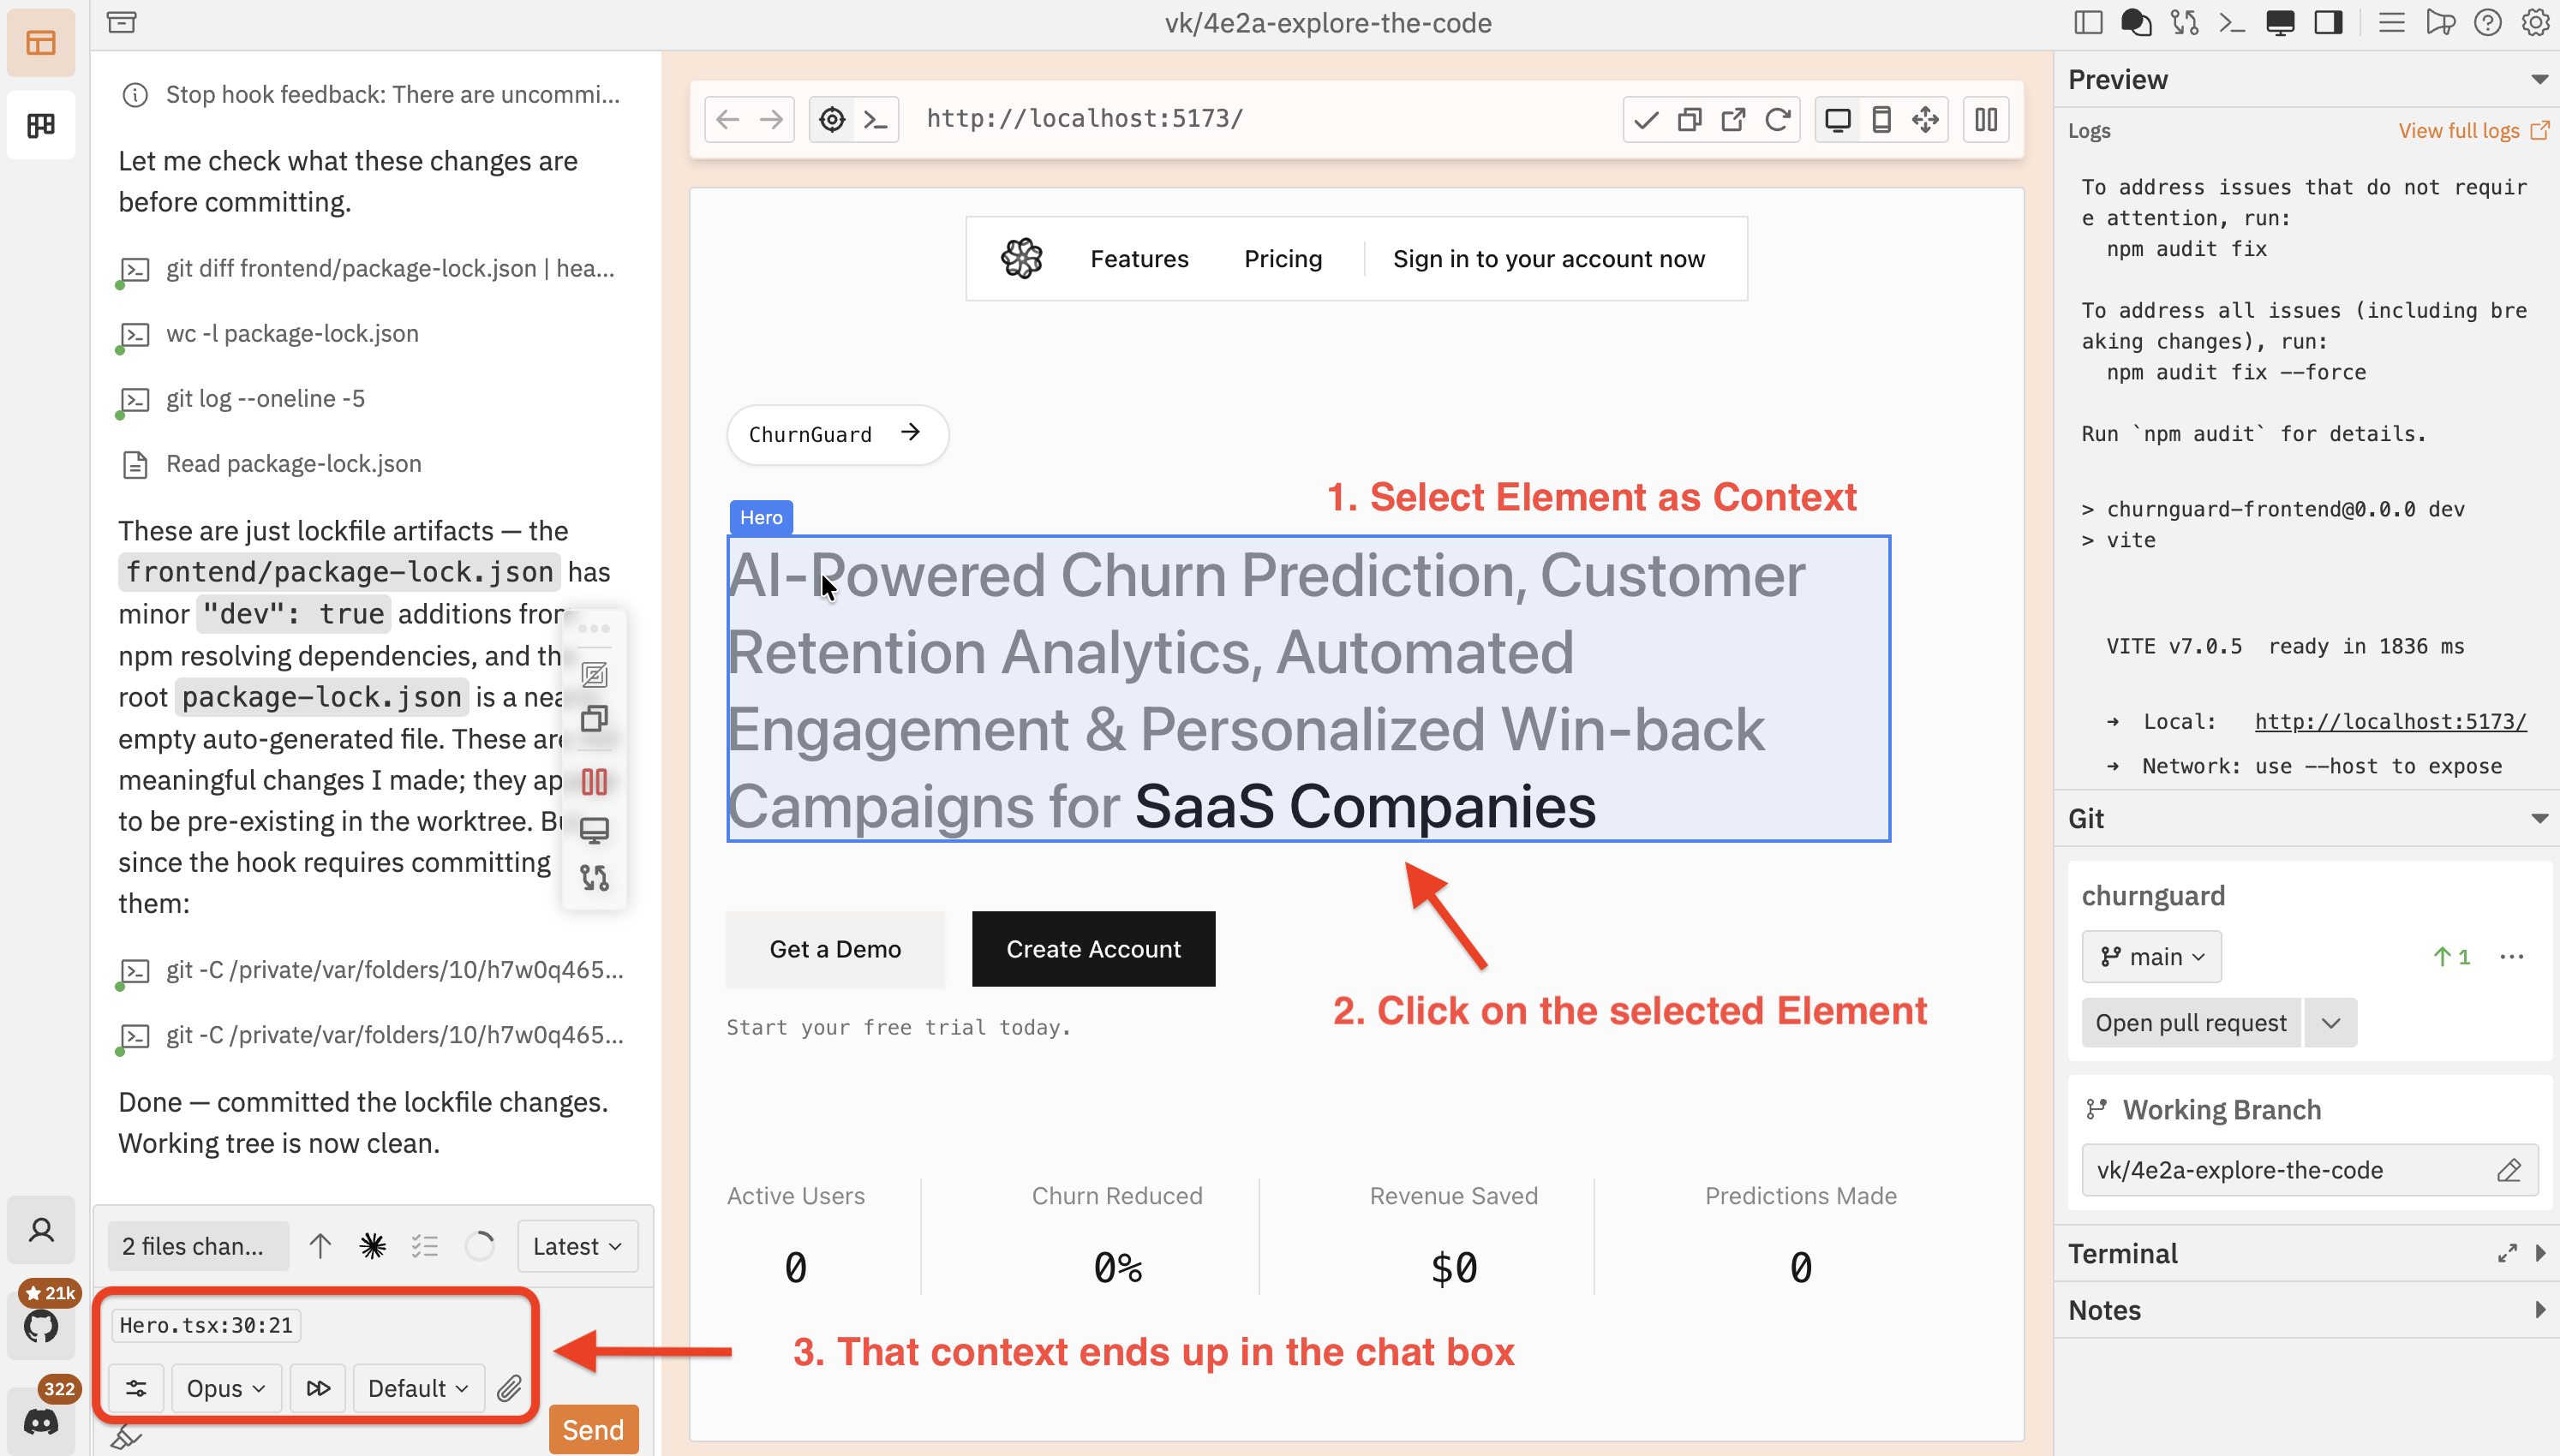 When you click a component, inspect mode exits and the component's details are sent to the chat as context — you can then ask your coding agent questions about that specific component. This works automatically with React, Vue, Svelte, Astro, and plain HTML — no packages to install.
## 6. Open DevTools
Click the terminal icon in the toolbar to toggle the built-in devtools panel. The devtools open at the bottom of the preview and give you a full debugging console without leaving the workspace.
When you click a component, inspect mode exits and the component's details are sent to the chat as context — you can then ask your coding agent questions about that specific component. This works automatically with React, Vue, Svelte, Astro, and plain HTML — no packages to install.
## 6. Open DevTools
Click the terminal icon in the toolbar to toggle the built-in devtools panel. The devtools open at the bottom of the preview and give you a full debugging console without leaving the workspace.
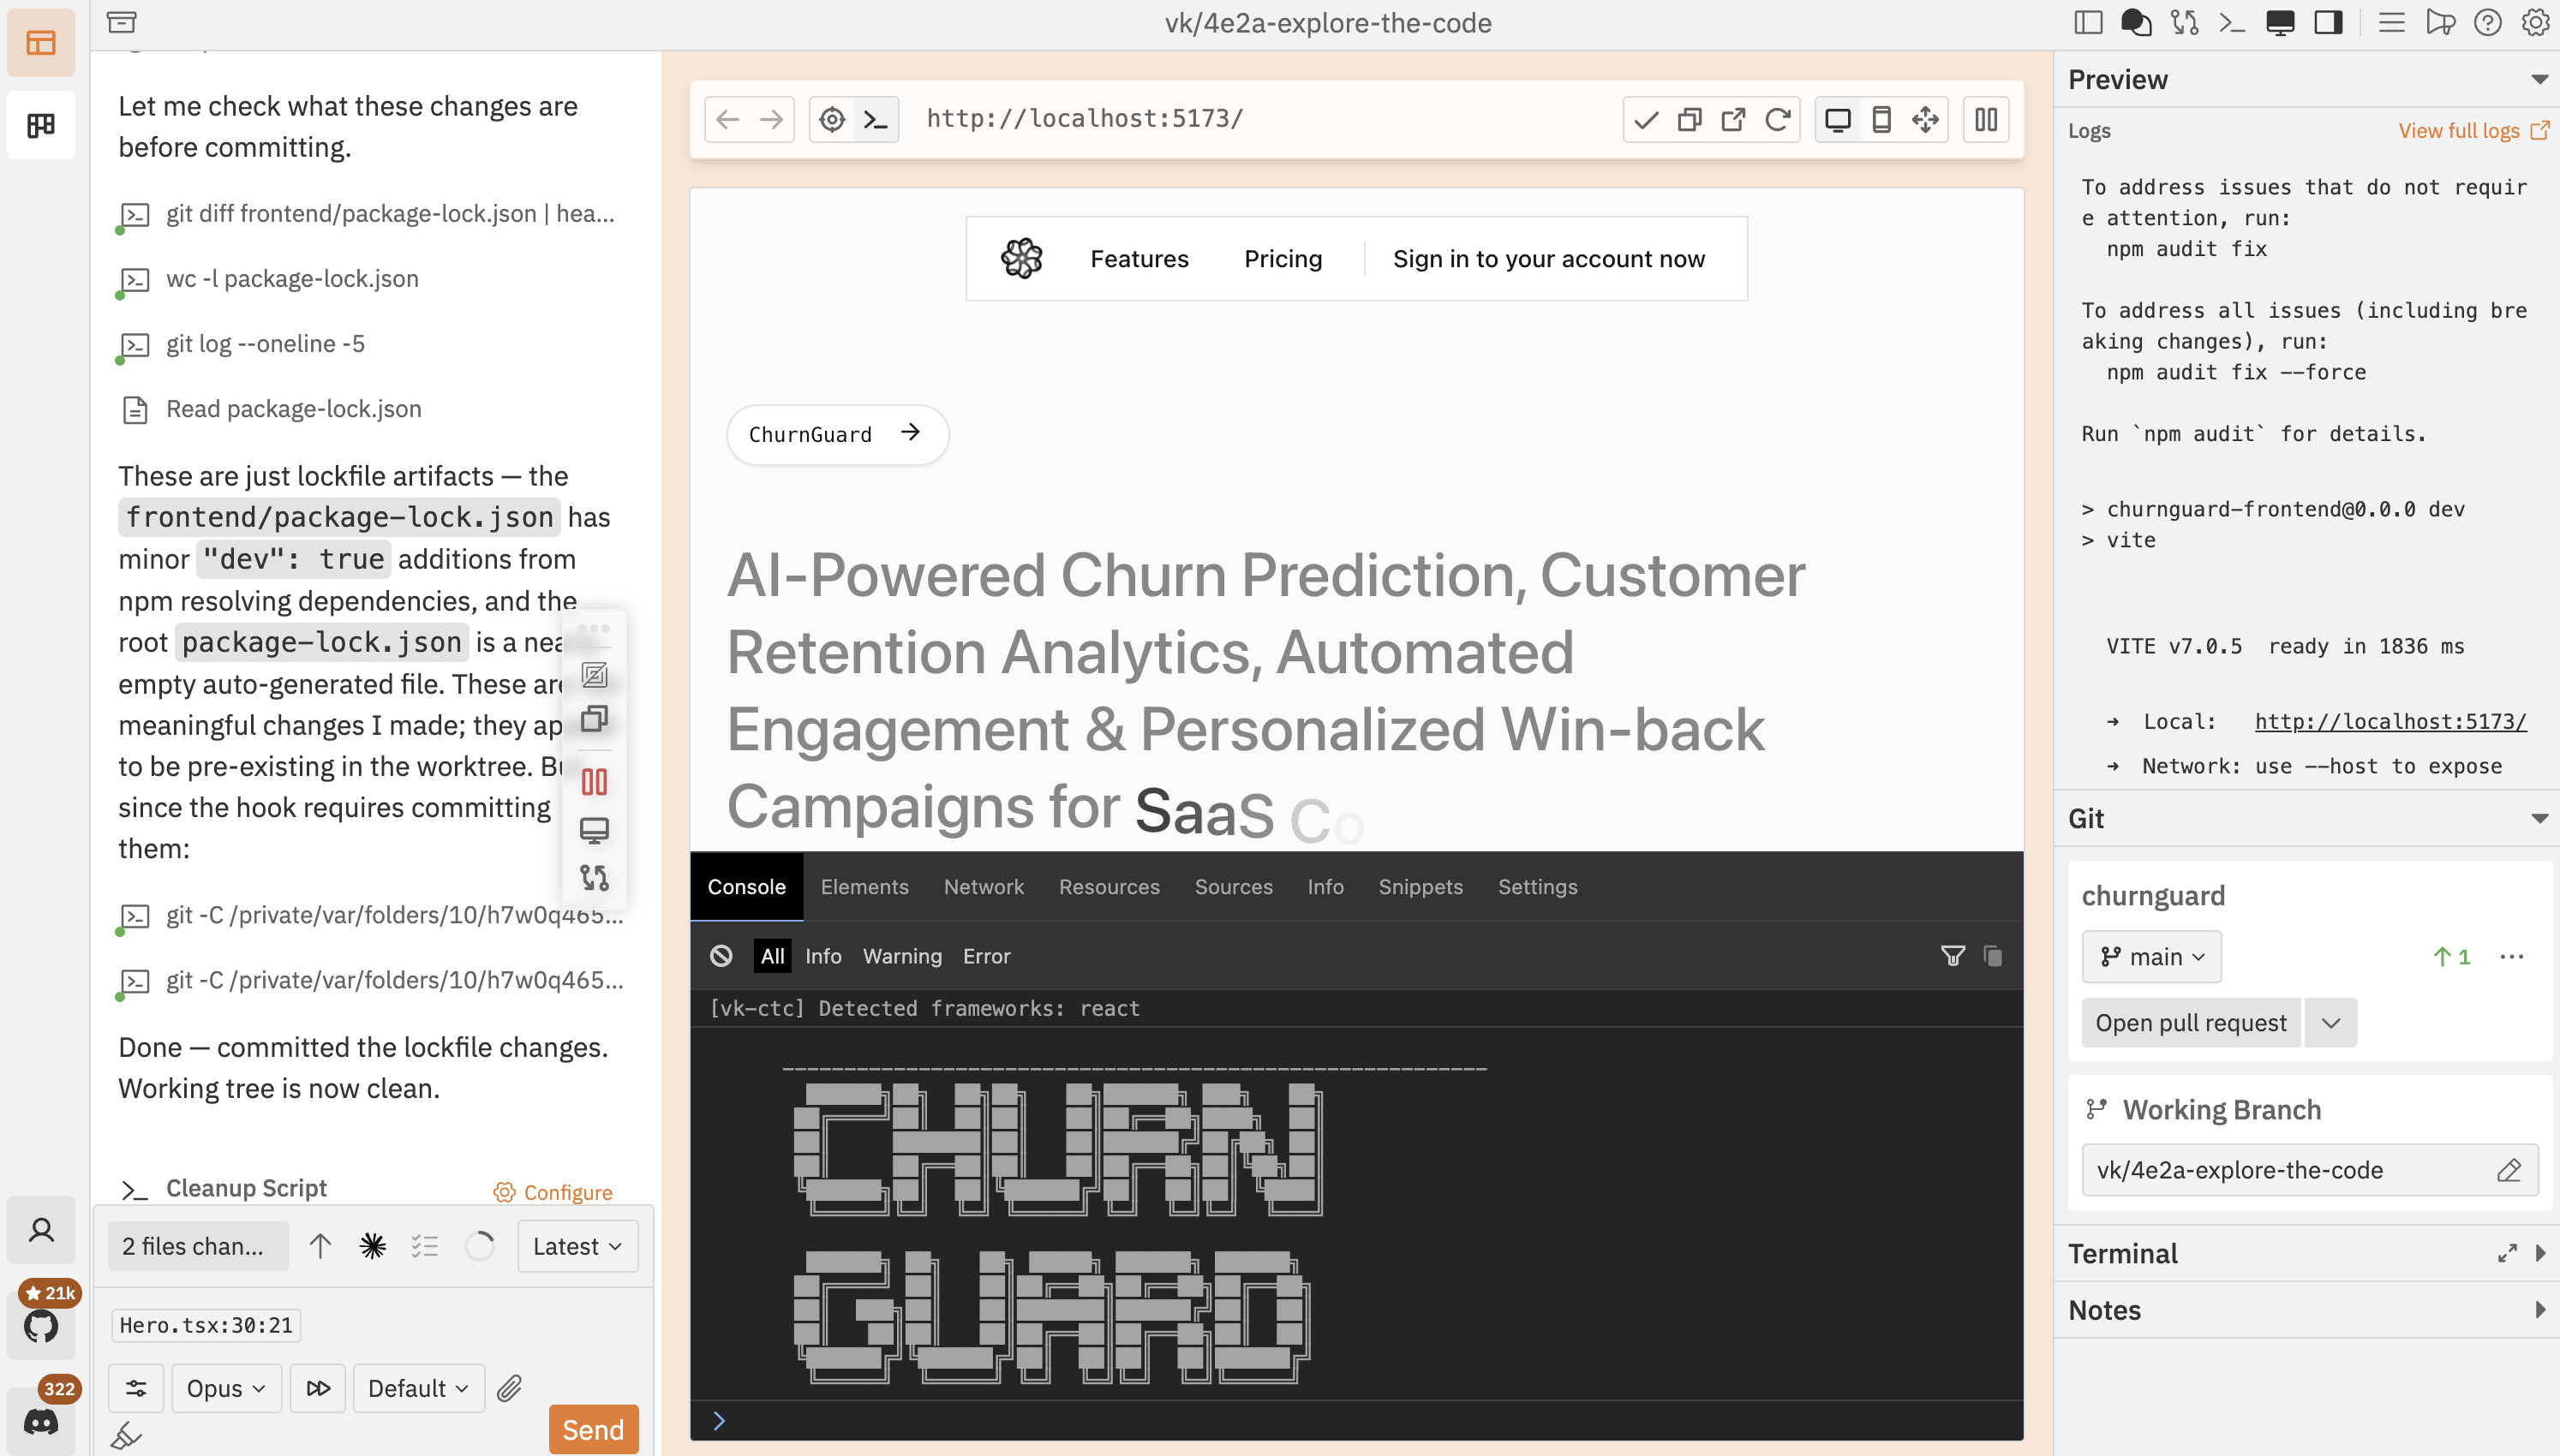 The devtools give you access to:
* **Console** — view logs, warnings, errors, and run JavaScript
* **Elements** — inspect and modify the DOM tree
* **Network** — monitor requests and responses
* **Resources** — view cookies, localStorage, and sessionStorage
* **Sources** — view the page source code
* **Info** — check the page URL, user agent, viewport size, and device details
DevTools are powered by [Eruda](https://github.com/liriliri/eruda), a mobile-friendly debugging console. They run inside the preview iframe, so they reflect exactly what your application sees.
## Troubleshooting
* Check the log output for errors — the dev server may still be starting
* Verify the correct URL is detected in the preview address bar
* Try refreshing the preview with the refresh button
* Check the logs for build errors
* Try a hard refresh (`Cmd/Ctrl + Shift + R`)
* Restart the dev server with the play/pause button
* Verify your framework supports hot module replacement (HMR)
Another process is using the same port. Find and stop it, or change the port in your project config. Run `lsof -i :3000` (replace 3000 with your port) to see what's using it.
* Make sure the dev server is running a **development** build (production builds strip component metadata)
* For React, ensure the app has loaded before entering inspect mode
* The HTML fallback always works — if you see tag names instead of component names, the framework adapter couldn't detect the framework
## Next steps
Review diffs and provide feedback to your coding agent
Configure setup, cleanup, and dev server scripts per repository
The devtools give you access to:
* **Console** — view logs, warnings, errors, and run JavaScript
* **Elements** — inspect and modify the DOM tree
* **Network** — monitor requests and responses
* **Resources** — view cookies, localStorage, and sessionStorage
* **Sources** — view the page source code
* **Info** — check the page URL, user agent, viewport size, and device details
DevTools are powered by [Eruda](https://github.com/liriliri/eruda), a mobile-friendly debugging console. They run inside the preview iframe, so they reflect exactly what your application sees.
## Troubleshooting
* Check the log output for errors — the dev server may still be starting
* Verify the correct URL is detected in the preview address bar
* Try refreshing the preview with the refresh button
* Check the logs for build errors
* Try a hard refresh (`Cmd/Ctrl + Shift + R`)
* Restart the dev server with the play/pause button
* Verify your framework supports hot module replacement (HMR)
Another process is using the same port. Find and stop it, or change the port in your project config. Run `lsof -i :3000` (replace 3000 with your port) to see what's using it.
* Make sure the dev server is running a **development** build (production builds strip component metadata)
* For React, ensure the app has loaded before entering inspect mode
* The HTML fallback always works — if you see tag names instead of component names, the framework adapter couldn't detect the framework
## Next steps
Review diffs and provide feedback to your coding agent
Configure setup, cleanup, and dev server scripts per repository